Authors:
(1) Ángel Merino, Department of Telematic Engineering Universidad Carlos III de Madrid {[email protected]};
(2) José González-Cabañas, UC3M-Santander Big Data Institute {[email protected]}
(3) Ángel Cuevas, Department of Telematic Engineering Universidad Carlos III de Madrid & UC3M-Santander Big Data Institute {[email protected]};
(4) Rubén Cuevas, Department of Telematic Engineering Universidad Carlos III de Madrid & UC3M-Santander Big Data Institute {[email protected]}.
Table of Links
LinkedIn Advertising Platform Background
Nanotargeting proof of concept
Ethics and legal considerations
Conclusions, Acknowledgments, and References
A Country distribution of users in our data sample
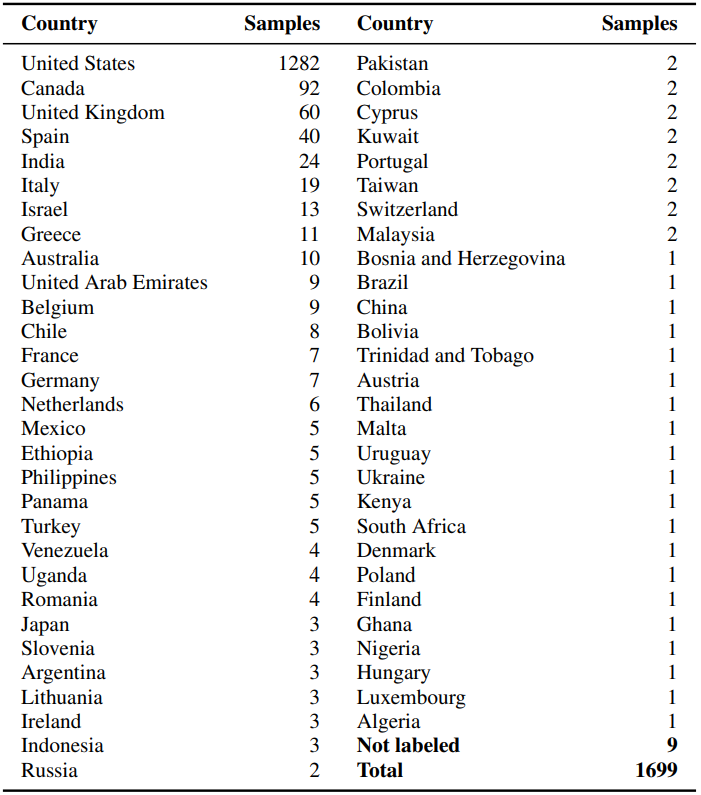
Our dataset contains samples from 58 different countries, but a few countries constitute most of our dataset, especially the United States. Table 4 shows the breakdown of the number of users per country in our dataset. About 75% of the users in our dataset are from the United States.
We acknowledge the fact that this circumstance in our data may lead to some biases in the results of our model and, therefore, to the estimation of N. However, the fact that the proof of concept experiment was targeting users in a different country than the US and the obtained results are aligned with the model outcome makes us confident that the potential bias (if any) may be slight.
As discussed in the paper, our intuition is that our model serves as an upper bound for the number of skills needed to make a user unique. This may be because the United States is one of the countries including more LinkedIn users. Therefore, it seems reasonable to estimate that, in many cases, it will be easier to re-identify users reporting a different location than the US.
B Model fitting in the other considered scenarios
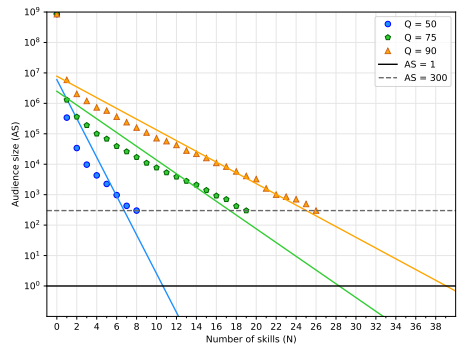
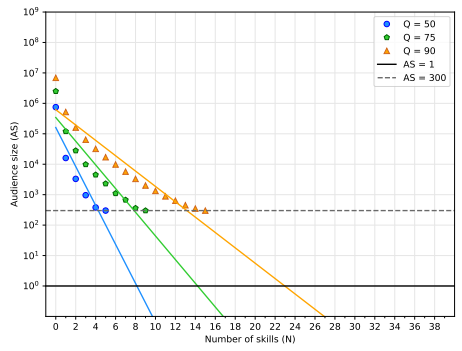
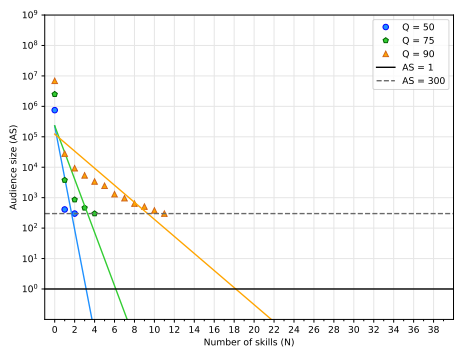
We apply our methodology to four different scenarios summarized in section 4.3. This appendix shows the model fitting for the other three scenarios not shown in the paper body referred to as (ii) Sk_LP (Figure 7), we only use the least popular professional skills; (iii) Lo_R (Figure 8), we use the location and professional skills selected at random; (iv) Lo_LP (Figure 9), we use the location and the least popular skills. Table 1 shows the R2 values for all the line fittings.
C LinkedIn dashboard report for the proof of concept experiment ad campaigns
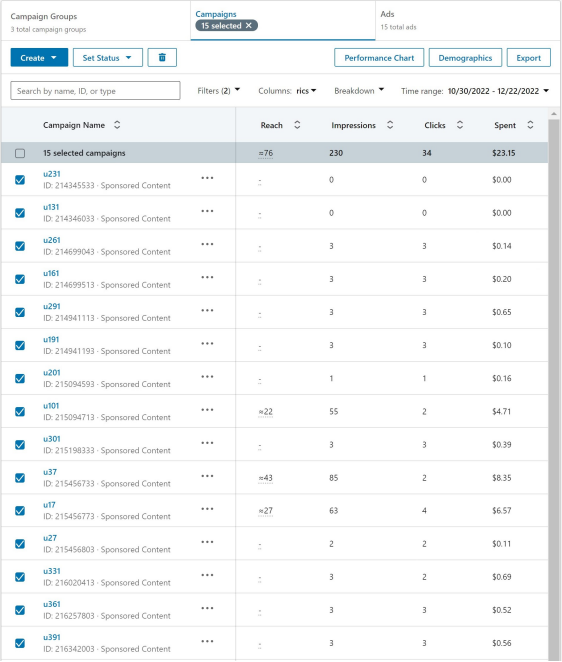
Some of the results reported in Table 3 were extracted from the LinkedIn Campaign Manager report for the different advertising campaigns delivered. Figure 10 shows a snapshot of the information reported by LinkedIn for the 15 ad campaigns executed in our proof of concept experiment. It shows the ID of the campaign, the budget spent, the number of delivered ad impressions, and the number of clicks received.
While we acknowledge that the report may not be 100% accurate, the fact that impressions counted by the targeted individuals in our experiment always match the number of impressions reported by LinkedIn leads us to think that
not only that the targeted users the only ones have received their corresponding ad, but also that the LinkedIn count is accurate, at least for audiences close to 1 user.
This paper is available on arxiv under CC BY-NC-ND 4.0 DEED license.

